We test each different combination possible into the logic network
We can represent all combinations by a table, but it is not practical and hard to read.
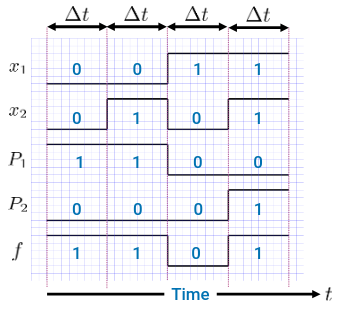
Timing Diagram
We draw the result of the output, and call that a timing diagram. It shows the changes in waveform for each internal signal of the logic network, and the resulting outputs. For now, “time” is represented by , which has a value which is equivalent to changing each variable.
Functionally Equivalent Networks
A network can be “equivalent”, aka implemented in different ways, but yield the same result.
We know that two logic networks are equivalent if
- Their truth tables are the same
- There exists a sequence of algebraic manipulations to transform one logic expression to the other
- Their Venn diagrams are the same
Footnotes
-
In reality, logic gates take some time to activate, and are not instant ↩